Finding the Needles in the Haystack: A New Approach to Anomaly Detection in Tabular Data
Anomaly detection is like searching for a needle in a haystack. It's about identifying unusual data points that stand out from the crowd, often indicating errors, fraud, or unexpected events. But what if you have limited data, or need to understand why something is anomalous? That's where a new framework called DIAD comes in, offering a powerful and interpretable approach to anomaly detection in tabular data.
Traditional anomaly detection methods often fall short in two key areas:
- Data scarcity: They struggle to leverage the small amount of labeled data (think "known needles") that's often available in real-world applications.
- Black box mystery: They act like opaque black boxes, leaving users clueless about why certain data points are flagged as anomalies. This lack of interpretability makes it hard to trust and act upon the results.
DIAD tackles these challenges head-on. It builds upon a "white-box" model called Generalized Additive Models (GAMs), which are inherently interpretable. GAMs break down complex relationships between variables into simpler, additive components, allowing you to see how each feature contributes to an anomaly.
But DIAD doesn't stop there. It also embraces the power of labeled data. By incorporating even a small amount of labeled anomalies, DIAD can significantly improve its accuracy, making it a true hybrid hero in the anomaly detection world.
Here's what makes DIAD special:
- Data-efficient: It makes the most of limited labeled data, boosting performance without requiring a massive haystack of labeled needles.
- Interpretable: It sheds light on the "why" behind anomalies, empowering users to understand and trust the results.
- Flexible: It adapts to different data types and complexities, making it a versatile tool for diverse anomaly detection tasks.
The researchers behind DIAD have shown that their framework outperforms existing methods in both unsupervised and semi-supervised settings. This means it can find needles in haystacks even when you have no clue where to start, and it can refine its needle-finding skills with just a few labeled examples.
So, if you're grappling with anomaly detection in tabular data, DIAD offers a promising new approach. It's data-efficient, interpretable, and flexible, making it a valuable tool for anyone looking to extract insights and make informed decisions from their haystack of data.
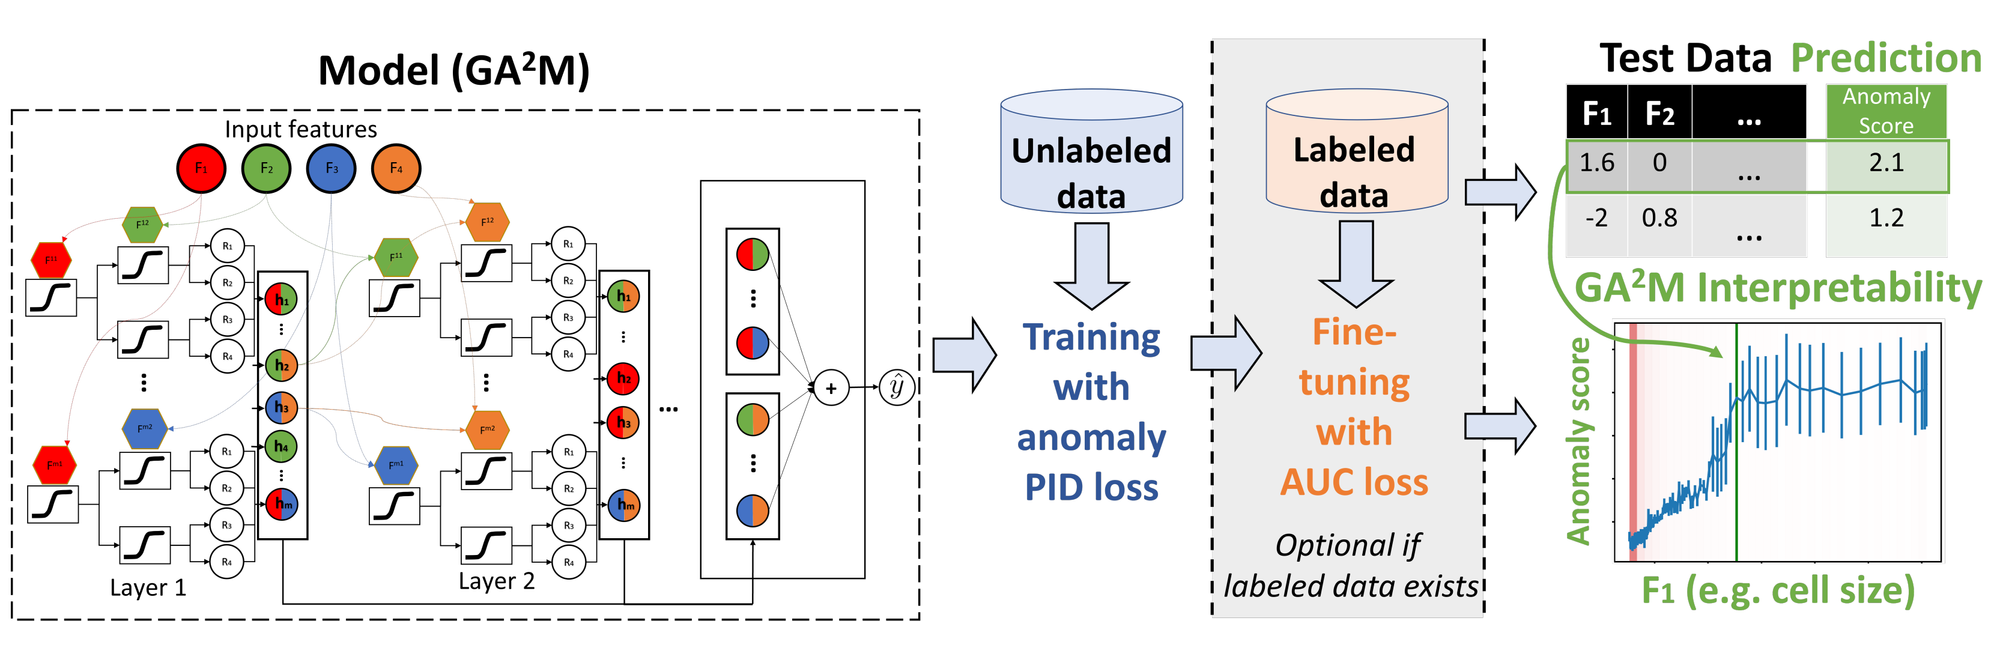
DIAD leverages the power of Generalized Additive Models (GAMs), a white-box model class known for its interpretability. GAMs decompose complex relationships between variables into simpler additive components, represented by smooth functions. This allows users to visualize and understand how each feature contributes to an anomaly, unlike the black-box nature of many traditional methods.
But DIAD's strength lies in its hybrid approach. It embraces the valuable information contained in even a small amount of labeled anomalies. DIAD employs a partial identification objective that utilizes both labeled and unlabeled data, effectively learning from both known and unknown anomalies. This leads to significantly improved accuracy, especially in semi-supervised settings where labeled data is limited.
Technical Details
- Partial Identification Objective: This clever objective function incorporates labeled anomalies without assuming knowledge of all possible anomaly types. It estimates the marginal effect of each feature on the probability of being an anomaly, even if not explicitly labeled as such.
- Interpretable Anomaly Scores: DIAD provides individual anomaly scores for each data point, along with feature-specific contributions. These scores, based on the GAM components, explain why a point is flagged as anomalous, offering valuable insights into the underlying data patterns.
- Flexibility and Adaptability: DIAD isn't a one-size-fits-all solution. It supports various data types and complexities, allowing users to adjust model parameters and feature transformations to optimize performance for specific datasets and tasks.
The researchers behind DIAD have demonstrated its effectiveness on several benchmark datasets, showcasing its ability to outperform existing methods in both unsupervised and semi-supervised settings.
- Improved Accuracy: DIAD consistently achieved higher F1 scores and AUC (Area Under the ROC Curve) values compared to baseline methods, particularly when incorporating labeled anomalies.
- Interpretable Insights: Feature-specific contributions provided by DIAD helped researchers identify key factors influencing anomalies, leading to better understanding of the underlying data dynamics.
DIAD provides a powerful and interpretable approach to anomaly detection in tabular data, especially when labeled data is scarce. Its ability to explain "why" alongside "what" makes it a valuable tool for gaining deeper insights into your data and making informed decisions. So, next time you're on the hunt for anomalies, consider DIAD as your trusty guide – it might just help you unravel the mysteries hidden within your haystack of data.
References