SHAP values for machine learning model explanation
In recent years, machine learning models have become increasingly complex and opaque. As these models are deployed in real-world settings, there is a growing need to interpret how they arrive at predictions. Model explanation and interpretability methods are essential for debugging models, ensuring fairness, and building trust with users. One approach that has gained popularity is SHAP (SHapley Additive exPlanations) values. In this post, we’ll provide an overview of how SHAP values can be used for machine learning model explanation.
How SHAP Values Work
SHAP values have their origins in game theory and Shapley values, which quantify how much each player in a collaborative game contributes to the total payout. SHAP adapts this concept to ML models by considering each feature value as a “player” in the model. The SHAP value for a feature measures how much that feature’s value contributes to the difference between the model's predicted output and the average model output.
More formally, SHAP values are based on Shapley values from game theory for fairly distributing payouts to players based on their contributions. For machine learning models, each feature value is considered a player, and the prediction is the payout. The Shapley value for a feature f is calculated by considering all possible combinations of feature coalitions and averaging the feature's marginal contribution across them. This requires exponential computations relative to the number of features. SHAP approximates these values using various methods to improve computational performance.
So in summary, the SHAP value for a feature indicates how much that feature contributed to moving the model's output from the base value (average model output) to the individual prediction. Features that push the prediction higher compared to the base value have positive SHAP values, while features that push the prediction lower have negative values. The magnitude reflects the strength of the influence.

Advantages of Using SHAP Values
There are several key benefits to using SHAP values for interpreting machine learning models:
- Model agnostic - They can be applied to any model, from linear models to complex neural networks.
- Captures feature interactions - SHAP values account for interaction effects between features.
- Quantifies feature importance - The values provide a numerically sound way to measure each feature's influence on the prediction.
- Visualizations for understanding - SHAP enables visual representations like summary plots and dependency plots to explain the model.
By combining the quantitative SHAP values with visual representations, users can gain key insights into how different features are influencing the model and their relative importance. Unlike some methods that assume a linear model or independence between features, SHAP values model feature interactions and accurately reflect the behavior of complex non-linear models. This model-agnostic approach makes them well-suited for explaining black box models.
Using SHAP Values in Practice
The SHAP Python package provides several useful functions for analyzing models. To demonstrate, we'll train a simple XGBoost model on the classic Iris flower data set for predicting species.
First, we calculate the SHAP values for each prediction:
import xgboost
from shap import KernelExplainer, summary_plot

model = xgboost.XGBClassifier()
model.fit(X_train, y_train)

explainer = KernelExplainer(model.predict, X_train)
shap_values = explainer.shap_values(X_test)

summary_plot(shap_values, X_test)
The SHAP summary plot gives an overview of how each feature impacts the predictions.
This shows petal length and width have the largest SHAP values, so they have the biggest influence driving predictions. Sepal length and width have lower impact.
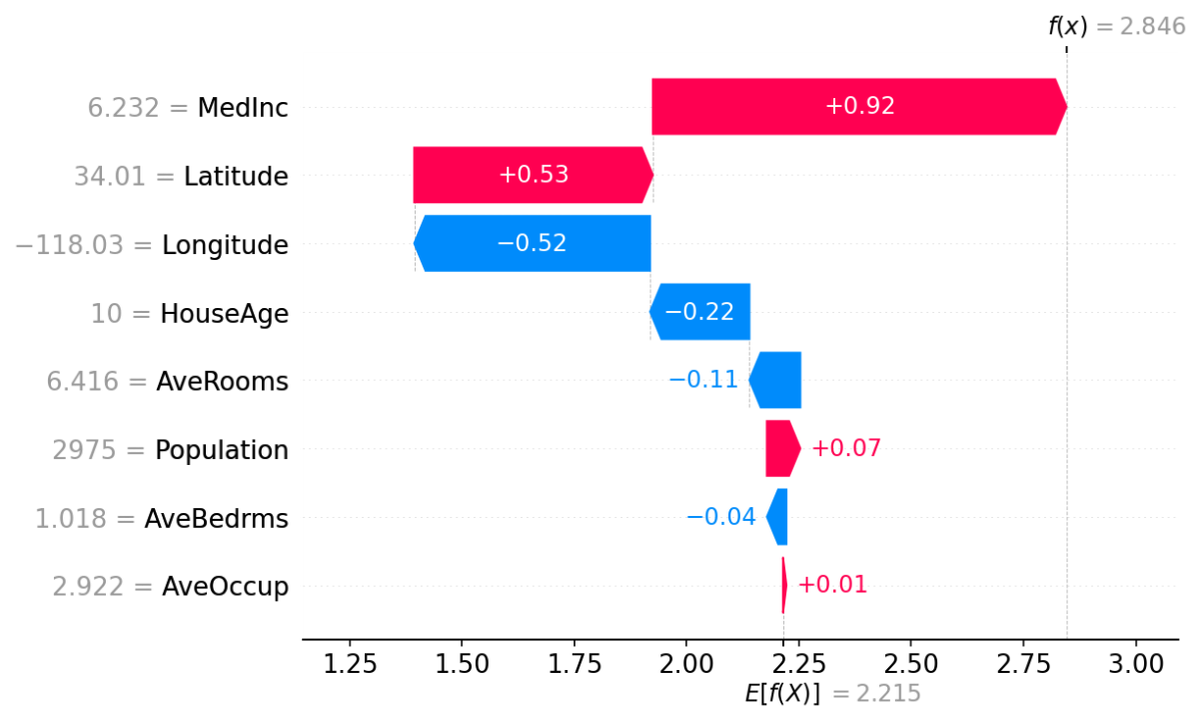
We can also visualize the SHAP values for a single prediction:
shap.force_plot(explainer.expected_value, shap_values[0,:], X_test.iloc[0,:])
This Force plot shows how each feature value deviates from the base value in that instance. The feature values with the largest deviations from the base value impact the prediction the most.
By analyzing plots like these over many predictions, we can gather key insights into how the different input features are influencing the model's predictions. If any surprising relationships are found, that can indicate areas to debug or improve the model.
Limitations and Considerations
While SHAP values have proven useful for explaining models, there are some limitations and caveats to consider:
- Computational complexity - Computing SHAP values has exponential complexity relative to the number of features. Approximation methods can improve performance but introduce accuracy tradeoffs.
- Difficulties with dependency plots - Visualizing how SHAP values vary with a feature can be challenging for high-cardinality categorical variables.
- Challenges explaining values - The raw SHAP values have little meaning on their own. Visualizations and comparisons are needed to interpret them.
Overall, SHAP values are best suited for analyzing models with tens to hundreds of features at most. They provide the most value when you combine the quantitative scores with visualizations to properly explain what the values represent.
Conclusion
Interpreting complex black box machine learning models is crucial for real-world deployment. SHAP values provide a model-agnostic approach to quantifying feature importance that accounts for feature interactions. By combining SHAP values with visualizations, users can better understand how models arrive at predictions. This enables debugging models, improving performance, and building trust by explaining how models work. While SHAP has some limitations like computational complexity, it is an invaluable tool for increasing interpretability and explainability of machine learning models.
References
- A Unified Approach to Interpreting Model Predictions [Link]